Logging in Kubernetes with Elasticsearch, Kibana, and Fluentd
This tutorial looks at how to spin up a single node Elasticsearch cluster along with Kibana and Fluentd on Kubernetes.
Dependencies:
- Docker v18.09.1
- Kubernetes v1.13.2
- Elasticsearch v6.5.4
- Kibana v6.5.4
- Fluentd v1.3.2
Contents
Minikube
Minikube is a tool that makes it easy for developers to use and run a “toy” Kubernetes cluster locally. It’s a great way to quickly get a cluster up and running so you can start interacting with the Kubernetes API.
If you already have a Kubernetes cluster up and running that you’d like to use, you can skip this section.
Follow the official quickstart guide to get Minikube installed along with:
- A Hypervisor (like VirtualBox or HyperKit) to manage virtual machines
- Kubectl to deploy and manage apps on Kubernetes
If you’re on a Mac, we recommend installing Kubectl, Hyperkit, and Minikube with Homebrew:
$ brew update
$ brew install kubectl
$ brew install docker-machine-driver-hyperkit
$ brew cask install minikube
By default, the Minikube VM is configured to use 1GB of memory and 2 CPU cores. This is not sufficient for Elasticsearch, so be sure to increase the memory in your Docker client (for HyperKit) or directly in VirtualBox. Then, when you start Minikube, pass the memory and CPU options to it:
$ minikube start --vm-driver=hyperkit --memory 8192 --cpus 4

or

$ minikube start --memory 8192 --cpus 4
Once up, make sure you can view the dashboard:
$ minikube dashboard
Then, create a new namespace:
$ kubectl create namespace logging

namespace/logging created
If you run into problems with Minikube, it’s often best to remove it completely and start over.
For example:
$ minikube stop; minikube delete
$ rm /usr/local/bin/minikube
$ rm -rf ~/.minikube
# re-download minikube
$ minikube start
Elastic
We’ll start with Elasticsearch.
You can find the code in the efk-kubernetes repo on GitHub.
kubernetes/elastic.yaml:
apiVersion: extensions/v1beta1
kind: Deployment
metadata:
  name: elasticsearch
spec:
  selector:
    matchLabels:
      component: elasticsearch
  template:
    metadata:
      labels:
        component: elasticsearch
    spec:
      containers:
      - name: elasticsearch
        image: docker.elastic.co/elasticsearch/elasticsearch:6.5.4
        env:
        - name: discovery.type
          value: single-node
        ports:
        - containerPort: 9200
          name: http
          protocol: TCP
        resources:
          limits:
            cpu: 500m
            memory: 4Gi
          requests:
            cpu: 500m
            memory: 4Gi

---

apiVersion: v1
kind: Service
metadata:
  name: elasticsearch
  labels:
    service: elasticsearch
spec:
  type: NodePort
  selector:
    component: elasticsearch
  ports:
  - port: 9200
    targetPort: 9200
So, this will spin up a single node Elasticsearch pod in the cluster along with a NodePort service to expose the pod to the outside world.
Create:
$ kubectl create -f kubernetes/elastic.yaml -n logging

deployment.extensions/elasticsearch created
service/elasticsearch created
Verify that both the pod and service were created:
$ kubectl get pods -n logging

NAME                          READY   STATUS    RESTARTS   AGE
elasticsearch-bb9f879-d9kmg   1/1     Running   0          75s


$ kubectl get service -n logging

NAME            TYPE       CLUSTER-IP       EXTERNAL-IP   PORT(S)          AGE
elasticsearch   NodePort   10.102.149.212   <none>        9200:30531/TCP   86s
Take note of the exposed port–e.g, 30531. Then, grab the Minikube IP and make sure you can cURL that pod:
$ curl $(minikube ip):30531
You should see something similar to:
{
  "name" : "9b5Whvv",
  "cluster_name" : "docker-cluster",
  "cluster_uuid" : "-qMwo61ATv2KmbZsf2_Tpw",
  "version" : {
    "number" : "6.5.4",
    "build_flavor" : "default",
    "build_type" : "tar",
    "build_hash" : "d2ef93d",
    "build_date" : "2018-12-17T21:17:40.758843Z",
    "build_snapshot" : false,
    "lucene_version" : "7.5.0",
    "minimum_wire_compatibility_version" : "5.6.0",
    "minimum_index_compatibility_version" : "5.0.0"
  },
  "tagline" : "You Know, for Search"
}
Kibana
Next, let’s get Kibana up and running.
kubernetes/kibana.yaml:
apiVersion: extensions/v1beta1
kind: Deployment
metadata:
  name: kibana
spec:
  selector:
    matchLabels:
      run: kibana
  template:
    metadata:
      labels:
        run: kibana
    spec:
      containers:
      - name: kibana
        image: docker.elastic.co/kibana/kibana:6.5.4
        env:
        - name: ELASTICSEARCH_URL
          value: http://elasticsearch:9200
        - name: XPACK_SECURITY_ENABLED
          value: "true"
        ports:
        - containerPort: 5601
          name: http
          protocol: TCP

---

apiVersion: v1
kind: Service
metadata:
  name: kibana
  labels:
    service: kibana
spec:
  type: NodePort
  selector:
    run: kibana
  ports:
  - port: 5601
    targetPort: 5601
Like before, this deployment will spin up a single Kibana pod that gets exposed via a NodePort service. Take note of the two environment variables:
ELASTICSEARCH_URL- URL of the Elasticsearch instanceXPACK_SECURITY_ENABLED- enables X-Pack security
Refer to the Running Kibana on Docker guide for more info on these variables.
Create:
$ kubectl create -f kubernetes/kibana.yaml -n logging
Verify:
$ kubectl get pods -n logging

NAME                          READY   STATUS    RESTARTS   AGE
elasticsearch-bb9f879-d9kmg   1/1     Running   0          17m
kibana-7f6686674c-mjlb2       1/1     Running   0          60s


$ kubectl get service -n logging

NAME            TYPE       CLUSTER-IP       EXTERNAL-IP   PORT(S)          AGE
elasticsearch   NodePort   10.102.149.212   <none>        9200:30531/TCP   17m
kibana          NodePort   10.106.226.34    <none>        5601:32683/TCP   74s
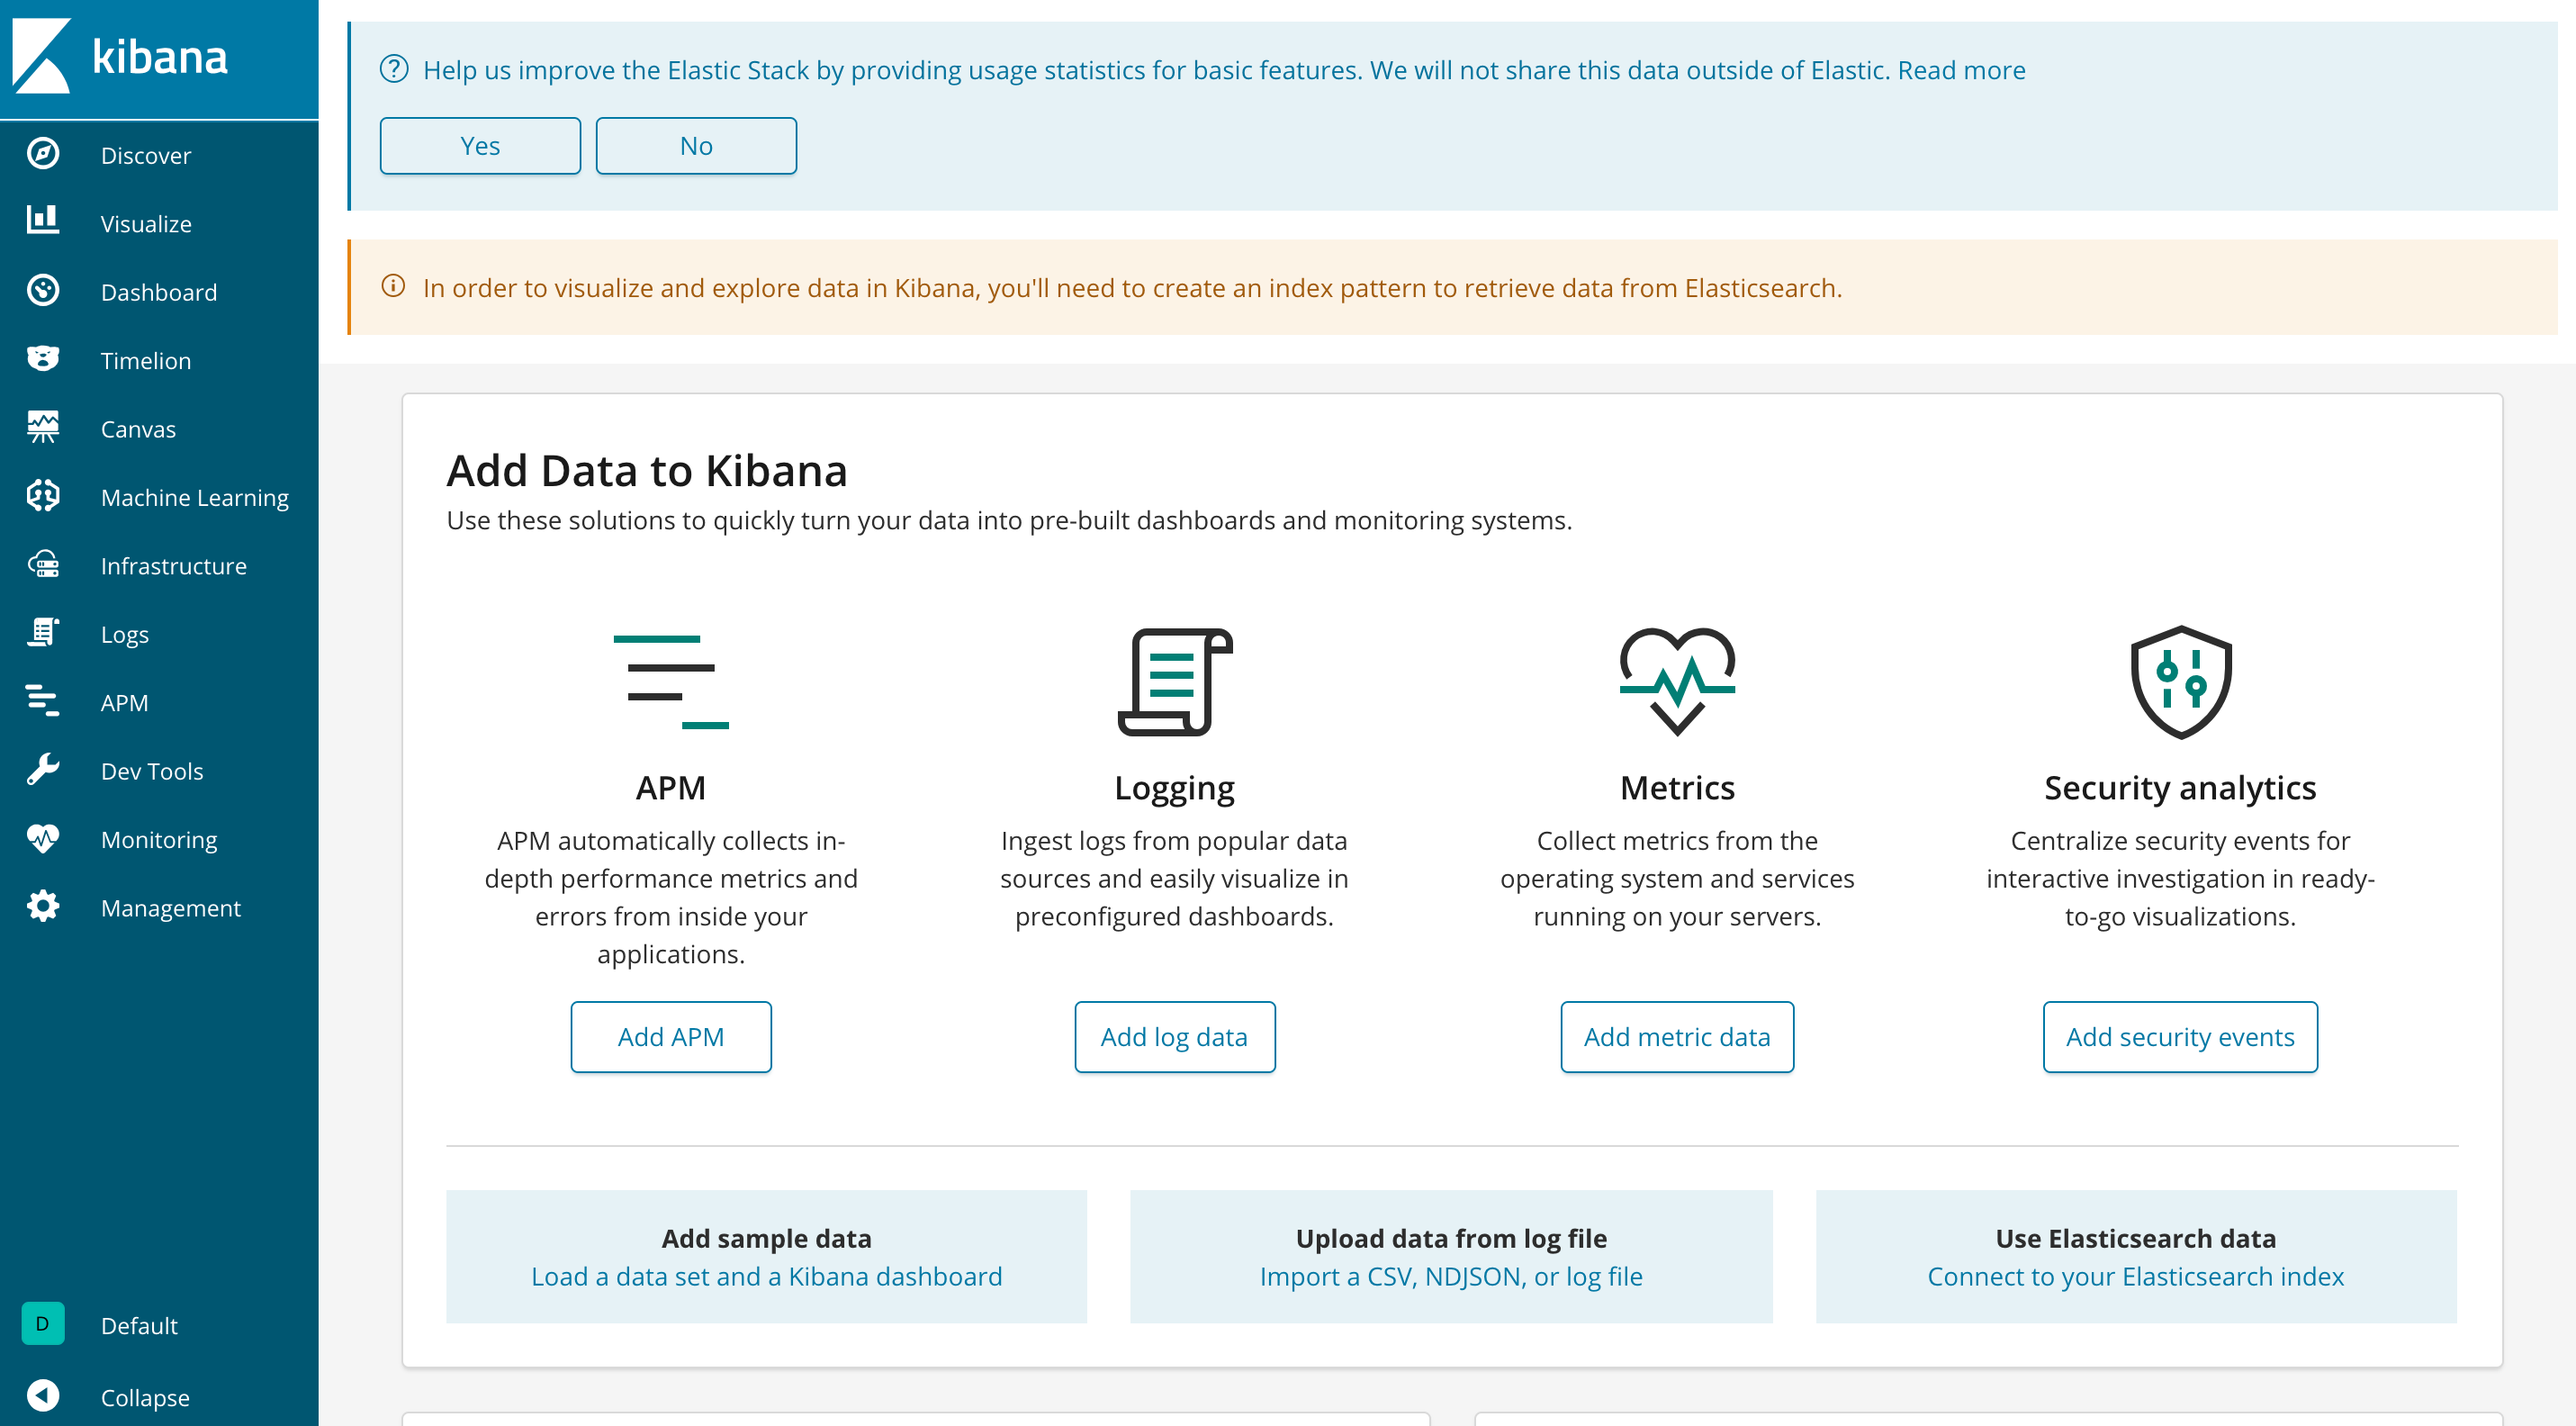
Test this in your browser at http://MINIKUBE_IP:KIBANA_EXPOSED_PORT.
Fluentd
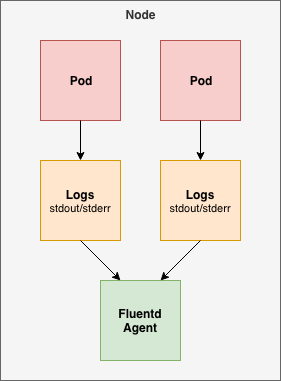
In this example, we’ll deploy a Fluentd logging agent to each node in the Kubernetes cluster, which will collect each container’s log files running on that node. We can use a DaemonSet for this.
First, we need to configure RBAC (role-based access control) permissions so that Fluentd can access the appropriate components.
kubernetes/fluentd-rbac.yaml:
apiVersion: v1
kind: ServiceAccount
metadata:
  name: fluentd
  namespace: kube-system

---

apiVersion: rbac.authorization.k8s.io/v1beta1
kind: ClusterRole
metadata:
  name: fluentd
  namespace: kube-system
rules:
- apiGroups:
  - ""
  resources:
  - pods
  - namespaces
  verbs:
  - get
  - list
  - watch

---

kind: ClusterRoleBinding
apiVersion: rbac.authorization.k8s.io/v1beta1
metadata:
  name: fluentd
roleRef:
  kind: ClusterRole
  name: fluentd
  apiGroup: rbac.authorization.k8s.io
subjects:
- kind: ServiceAccount
  name: fluentd
  namespace: kube-system
In short, this will create a ClusterRole which grants get, list, and watch permissions on pods and namespace objects. The ClusterRoleBinding then binds the ClusterRole to the ServiceAccount within the kube-system namespace. Refer to the Using RBAC Authorization guide to learn more about RBAC and ClusterRoles.
Create:
$ kubectl create -f kubernetes/fluentd-rbac.yaml
Now, we can create the DaemonSet.
kubernetes/fluentd-daemonset.yaml:
apiVersion: extensions/v1beta1
kind: DaemonSet
metadata:
  name: fluentd
  namespace: kube-system
  labels:
    k8s-app: fluentd-logging
    version: v1
    kubernetes.io/cluster-service: "true"
spec:
  template:
    metadata:
      labels:
        k8s-app: fluentd-logging
        version: v1
        kubernetes.io/cluster-service: "true"
    spec:
      serviceAccount: fluentd
      serviceAccountName: fluentd
      tolerations:
      - key: node-role.kubernetes.io/master
        effect: NoSchedule
      containers:
      - name: fluentd
        image: fluent/fluentd-kubernetes-daemonset:v1.3-debian-elasticsearch
        env:
          - name:  FLUENT_ELASTICSEARCH_HOST
            value: "elasticsearch.logging"
          - name:  FLUENT_ELASTICSEARCH_PORT
            value: "9200"
          - name: FLUENT_ELASTICSEARCH_SCHEME
            value: "http"
          - name: FLUENT_UID
            value: "0"
        resources:
          limits:
            memory: 200Mi
          requests:
            cpu: 100m
            memory: 200Mi
        volumeMounts:
        - name: varlog
          mountPath: /var/log
        - name: varlibdockercontainers
          mountPath: /var/lib/docker/containers
          readOnly: true
      terminationGracePeriodSeconds: 30
      volumes:
      - name: varlog
        hostPath:
          path: /var/log
      - name: varlibdockercontainers
        hostPath:
          path: /var/lib/docker/containers
Be sure to review Kubernetes Logging with Fluentd along with the sample Daemonset. Make sure FLUENT_ELASTICSEARCH_HOST aligns with the SERVICE_NAME.NAMESPACE of Elasticsearch within your cluster.
Deploy:
$ kubectl create -f kubernetes/fluentd-daemonset.yaml
If you’re running Kubernetes as a single node with Minikube, this will create a single Fluentd pod in the kube-system namespace.
$ kubectl get pods -n kube-system

coredns-576cbf47c7-mhxbp                1/1     Running   0          120m
coredns-576cbf47c7-vx7m7                1/1     Running   0          120m
etcd-minikube                           1/1     Running   0          119m
fluentd-kxc46                           1/1     Running   0          89s
kube-addon-manager-minikube             1/1     Running   0          119m
kube-apiserver-minikube                 1/1     Running   0          119m
kube-controller-manager-minikube        1/1     Running   0          119m
kube-proxy-m4vzt                        1/1     Running   0          120m
kube-scheduler-minikube                 1/1     Running   0          119m
kubernetes-dashboard-5bff5f8fb8-d64qs   1/1     Running   0          120m
storage-provisioner                     1/1     Running   0          120m
Take note of the logs:
$ kubectl logs fluentd-kxc46 -n kube-system
You should see that Fluentd connect to Elasticsearch within the logs:
Connection opened to Elasticsearch cluster =>
  {:host=>"elasticsearch.logging", :port=>9200, :scheme=>"http"}
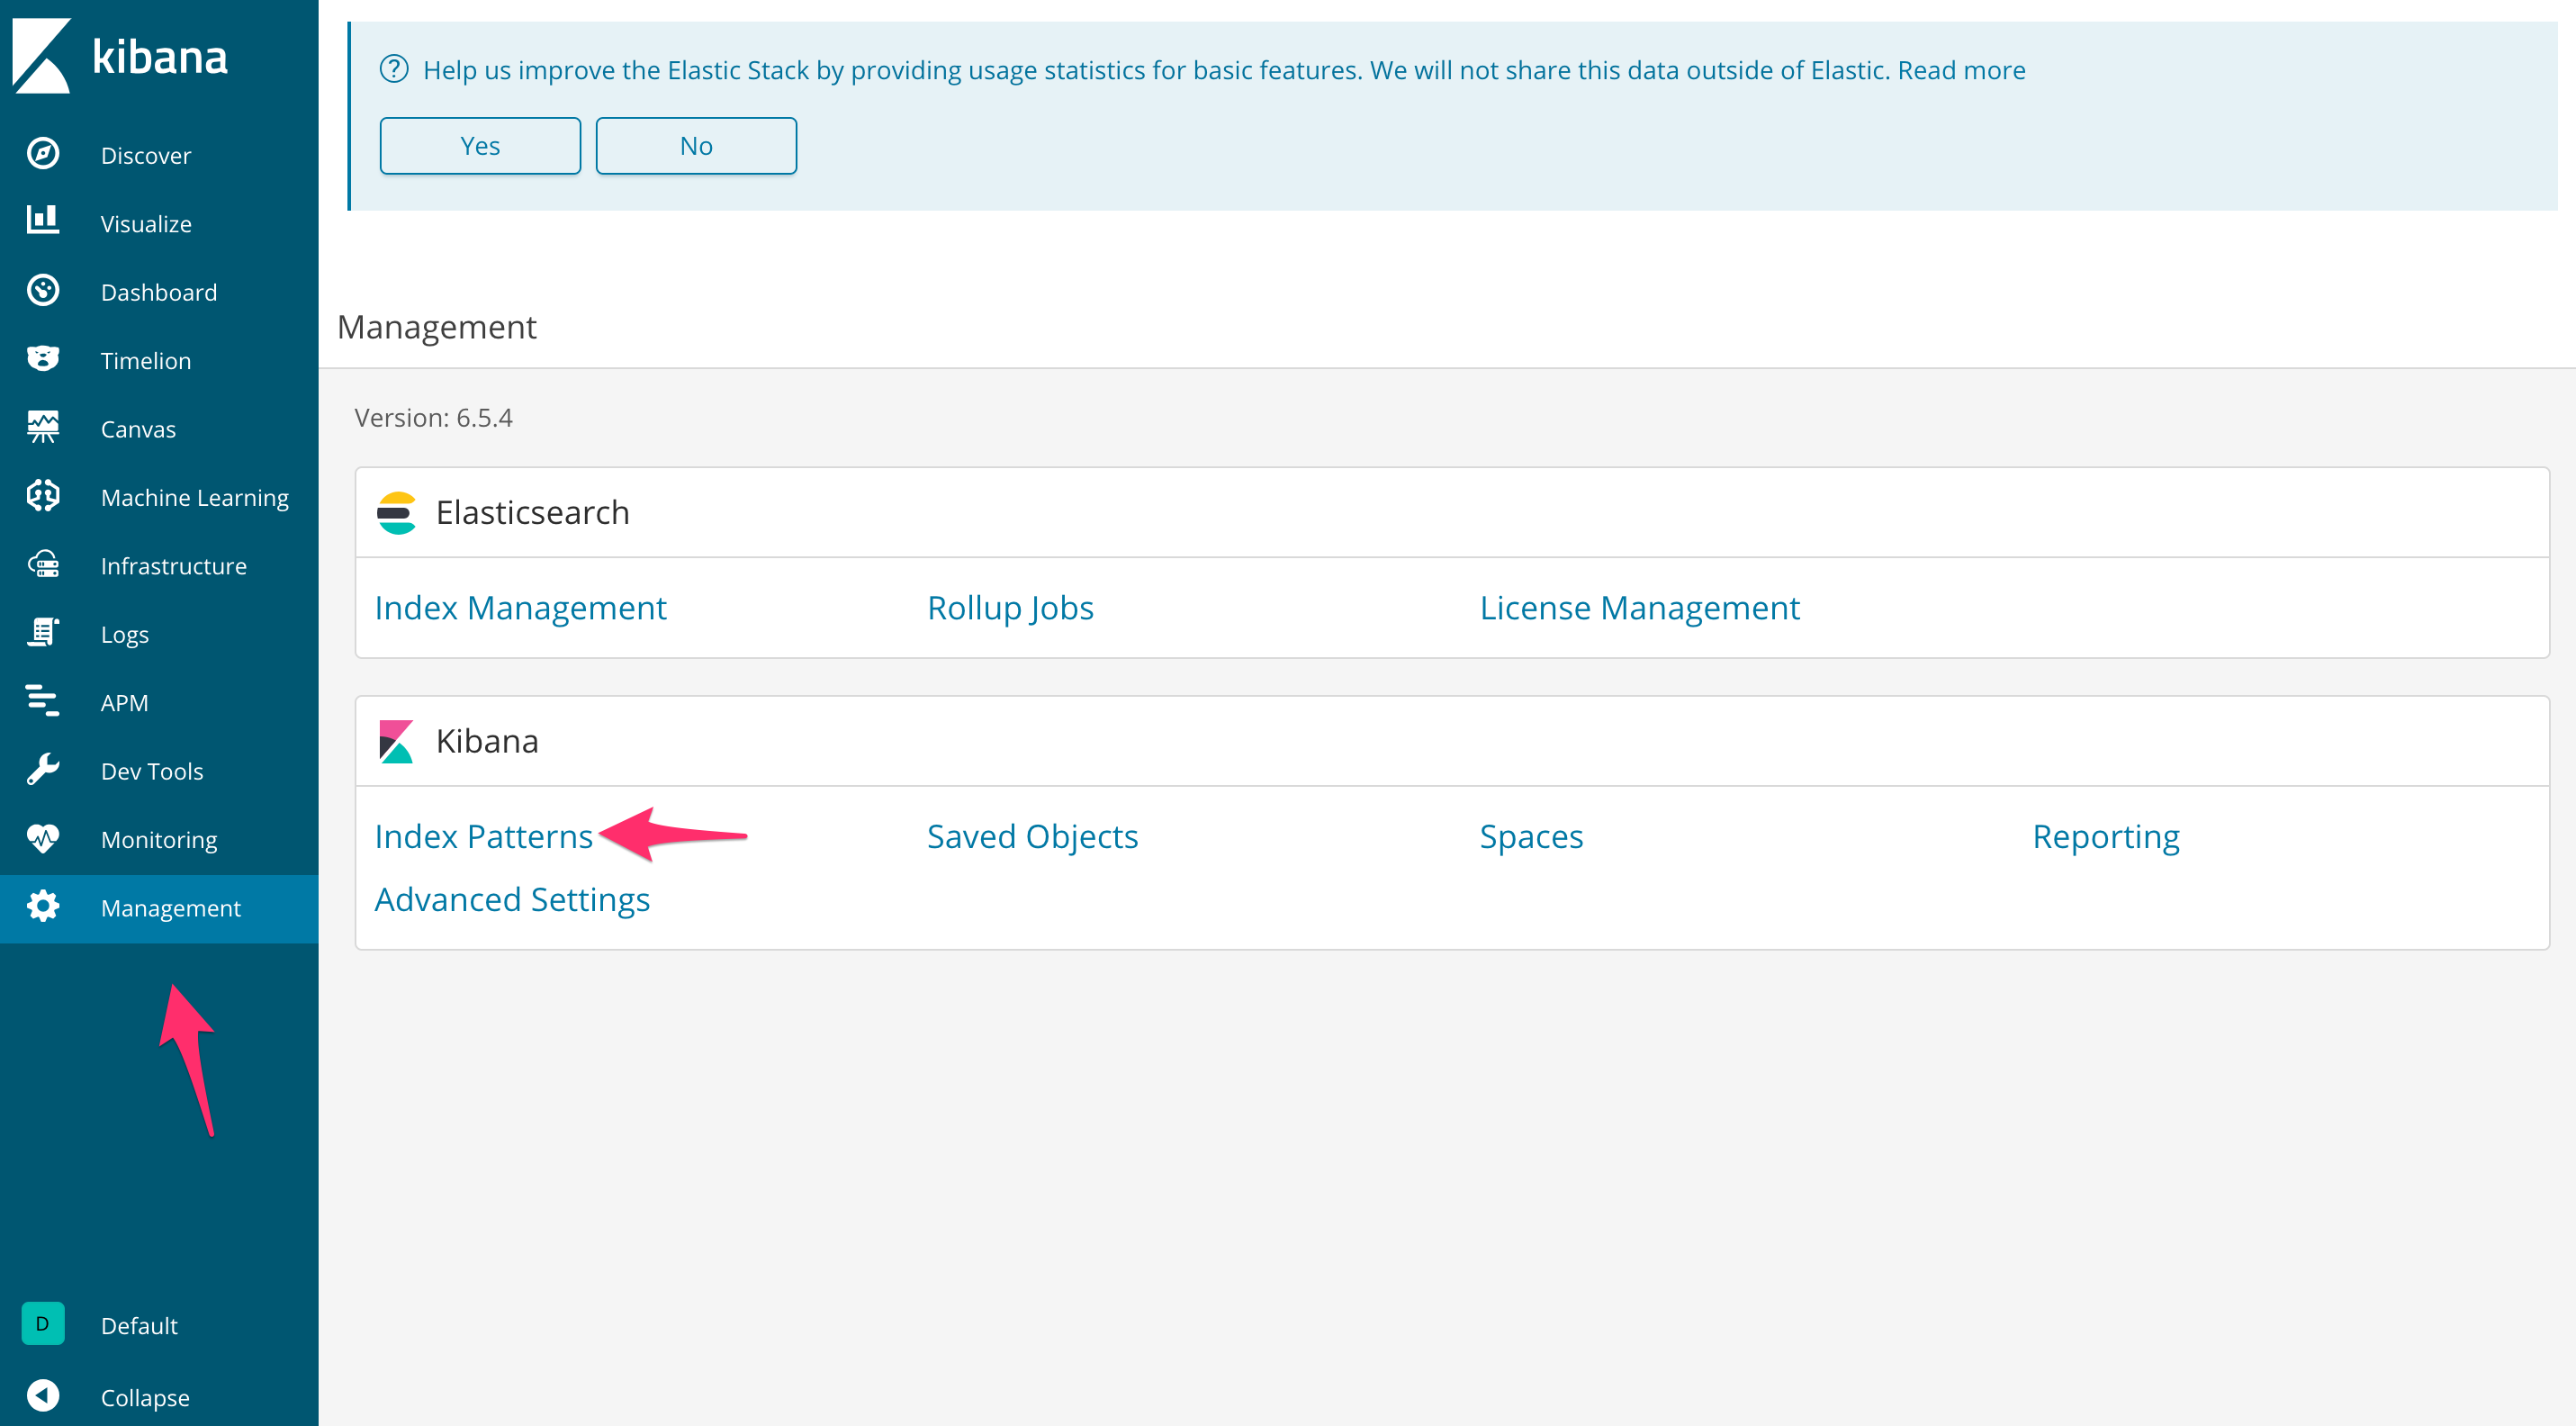
To see the logs collected by Fluentd in Kibana, click “Management” and then select “Index Patterns” under “Kibana”.
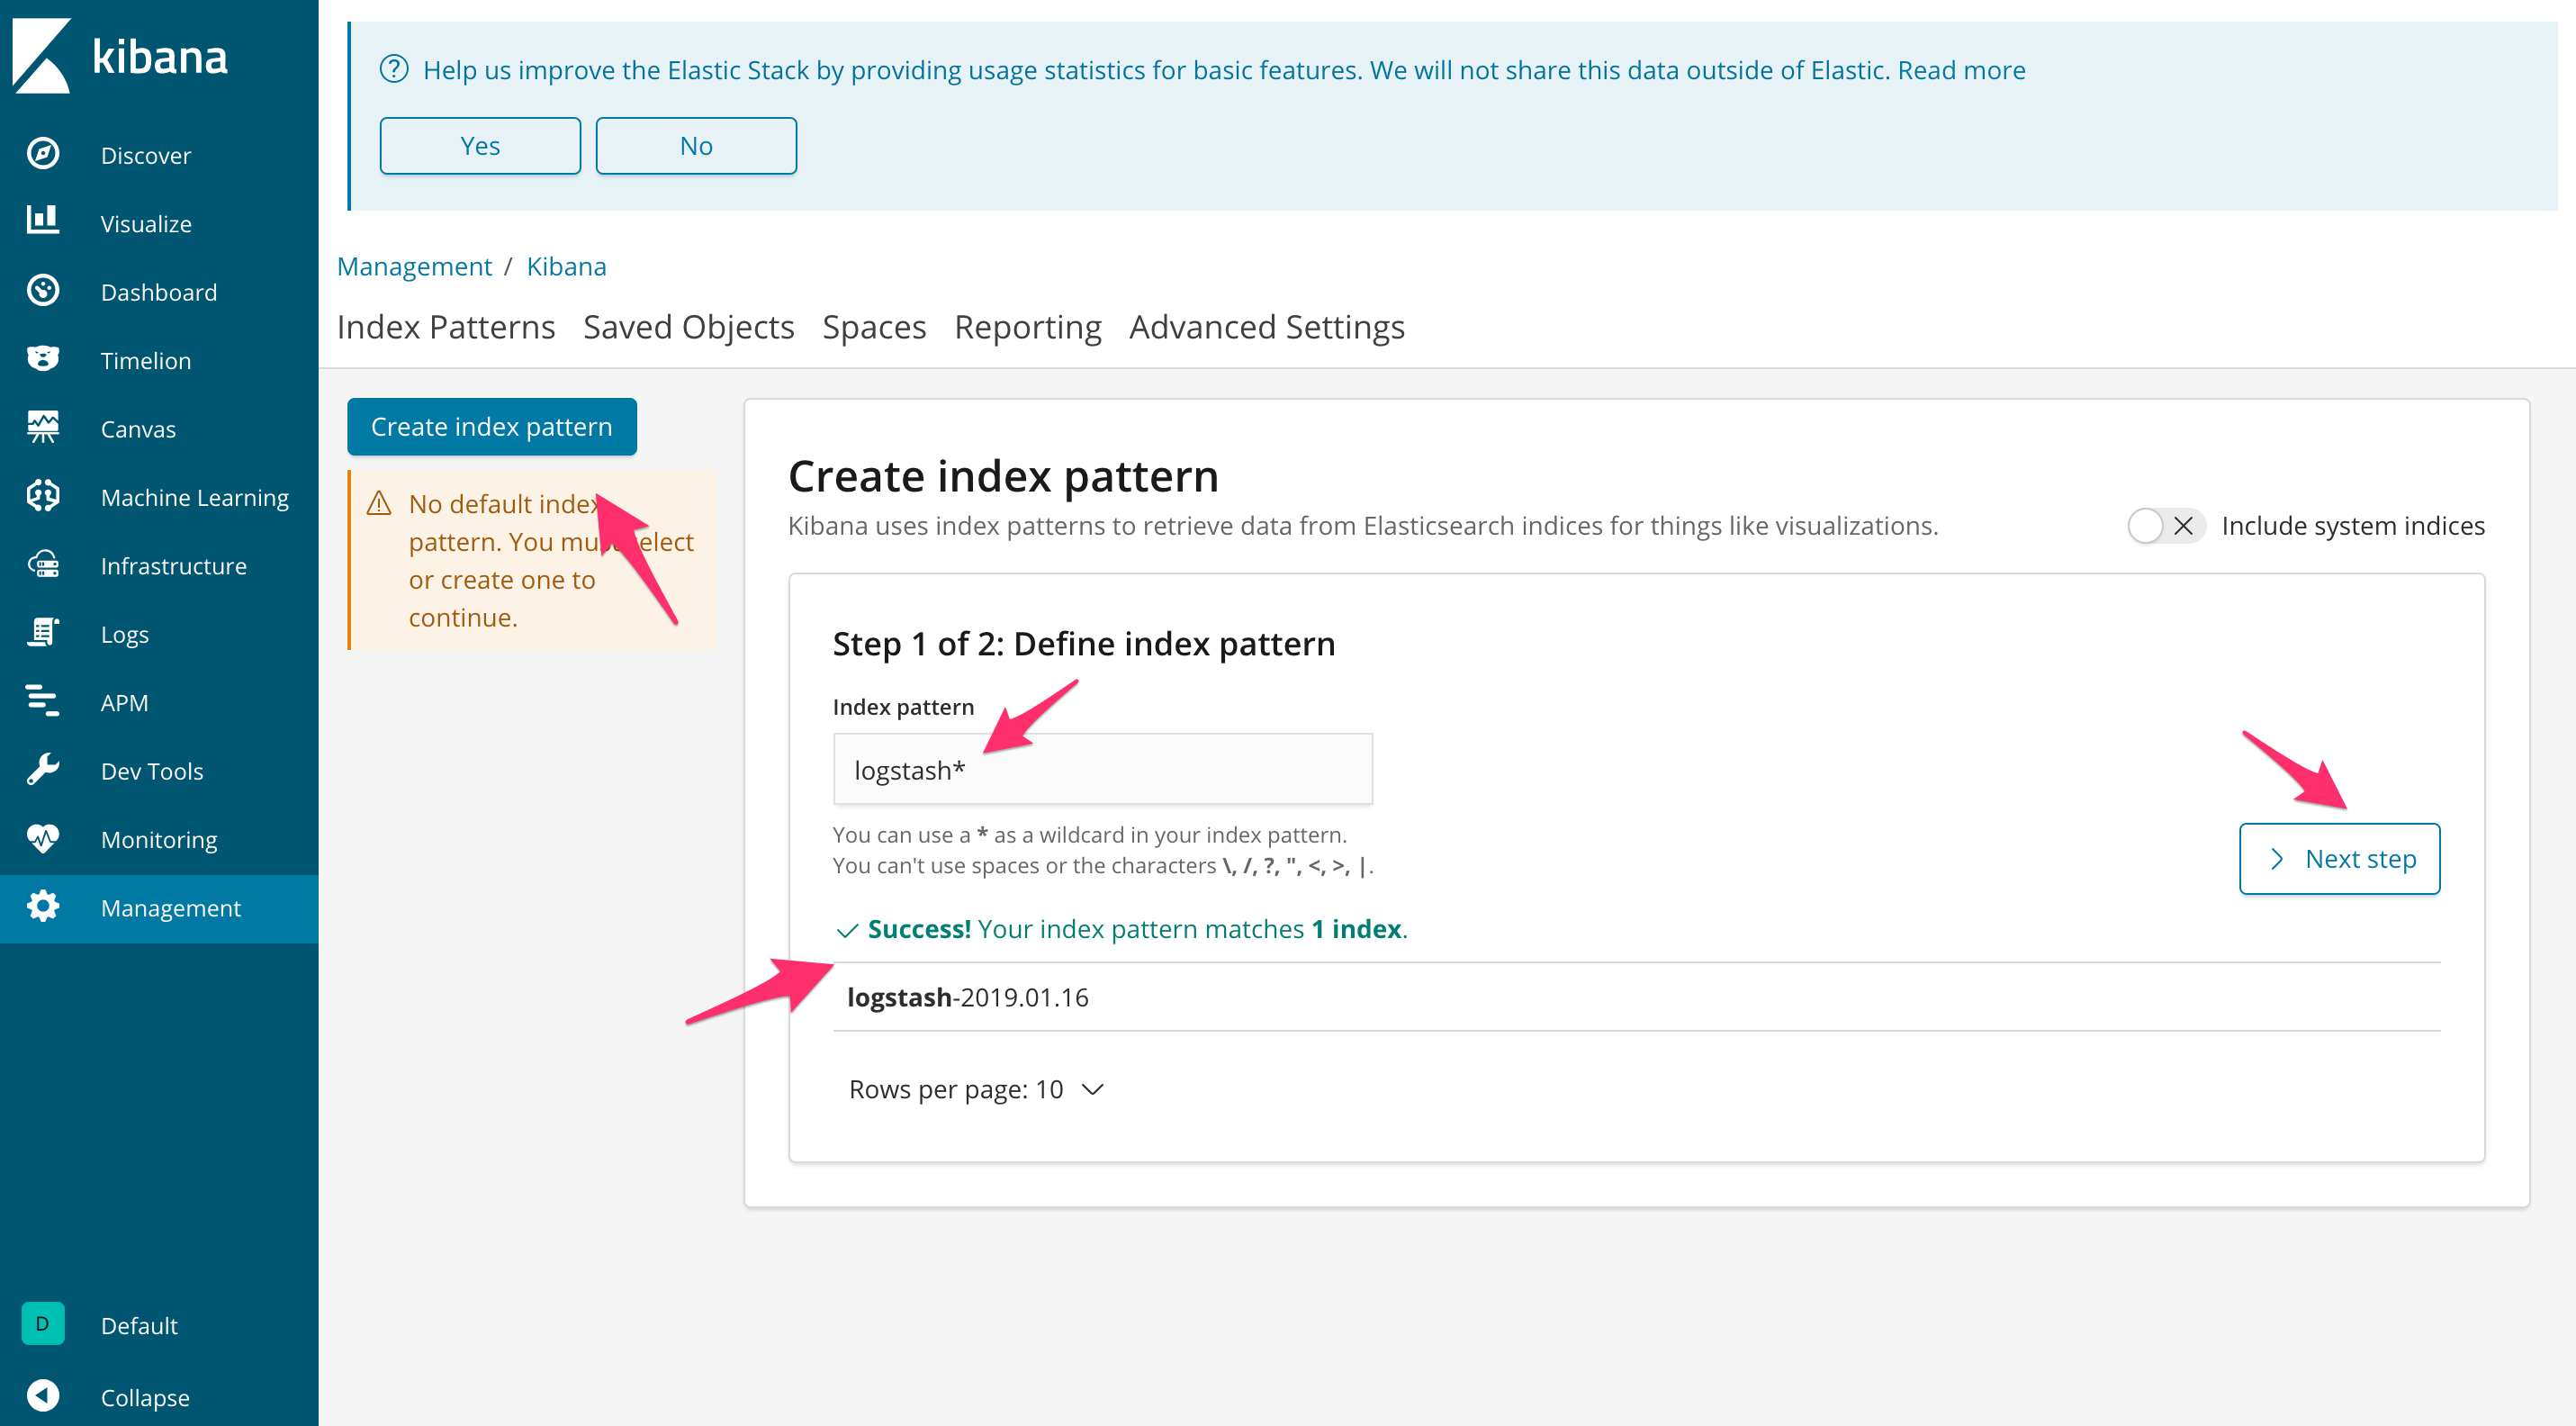
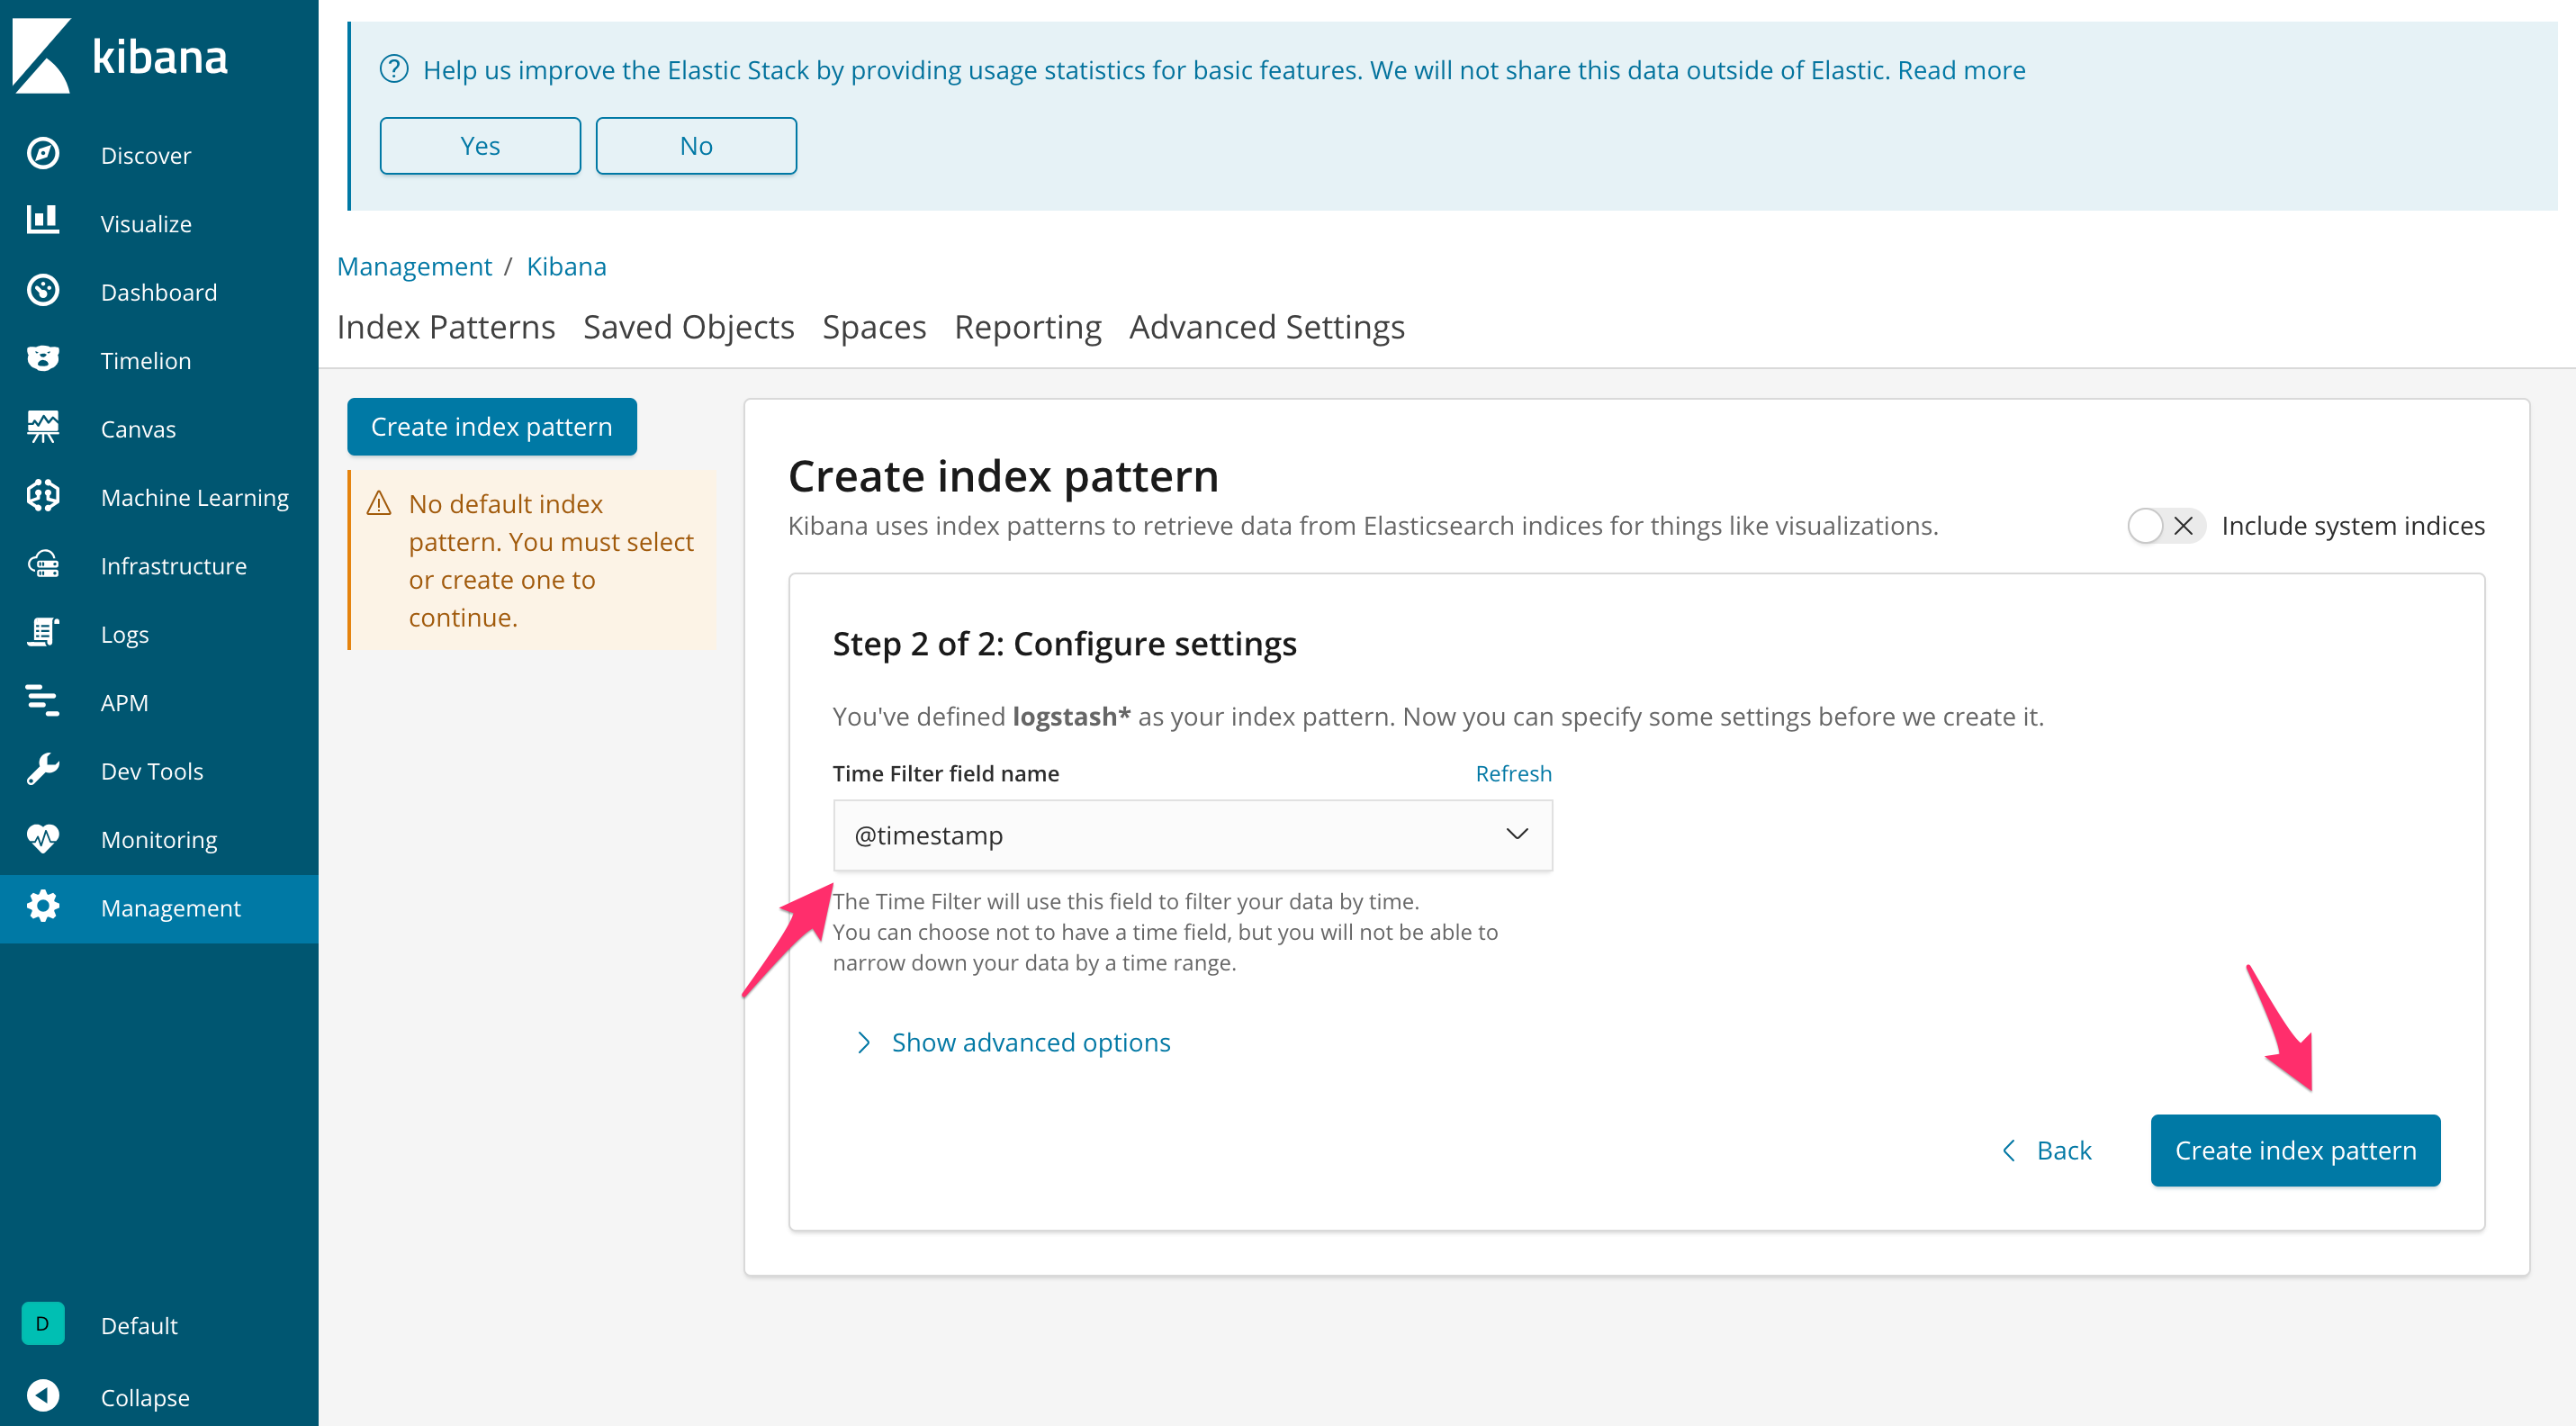
Click the “Create index pattern” button. Select the new Logstash index that is generated by the Fluentd DaemonSet. Click “Next step”.
Set the “Time Filter field name” to “@timestamp”. Then, click “Create index pattern”.
Click “Discover” to view your application logs.
Sanity Check
Let’s spin up a quick Node.js app to test.
Point your local Docker client at the Minikube Docker daemon, and then build the image:
$ eval $(minikube docker-env)
$ docker build -t fluentd-node-sample:latest -f sample-app/Dockerfile sample-app
Create the deployment:
$ kubectl create -f kubernetes/node-deployment.yaml
Take a quick look at the app in sample-app/index.js:
const SimpleNodeLogger = require('simple-node-logger');
const opts = {
  timestampFormat:'YYYY-MM-DD HH:mm:ss.SSS'
};
const log = SimpleNodeLogger.createSimpleLogger(opts);

(function repeatMe() {
  setTimeout(() => {
    log.info('it works');
    repeatMe();
  }, 1000)
})();
So, it just logs 'it works' to stdout every second.
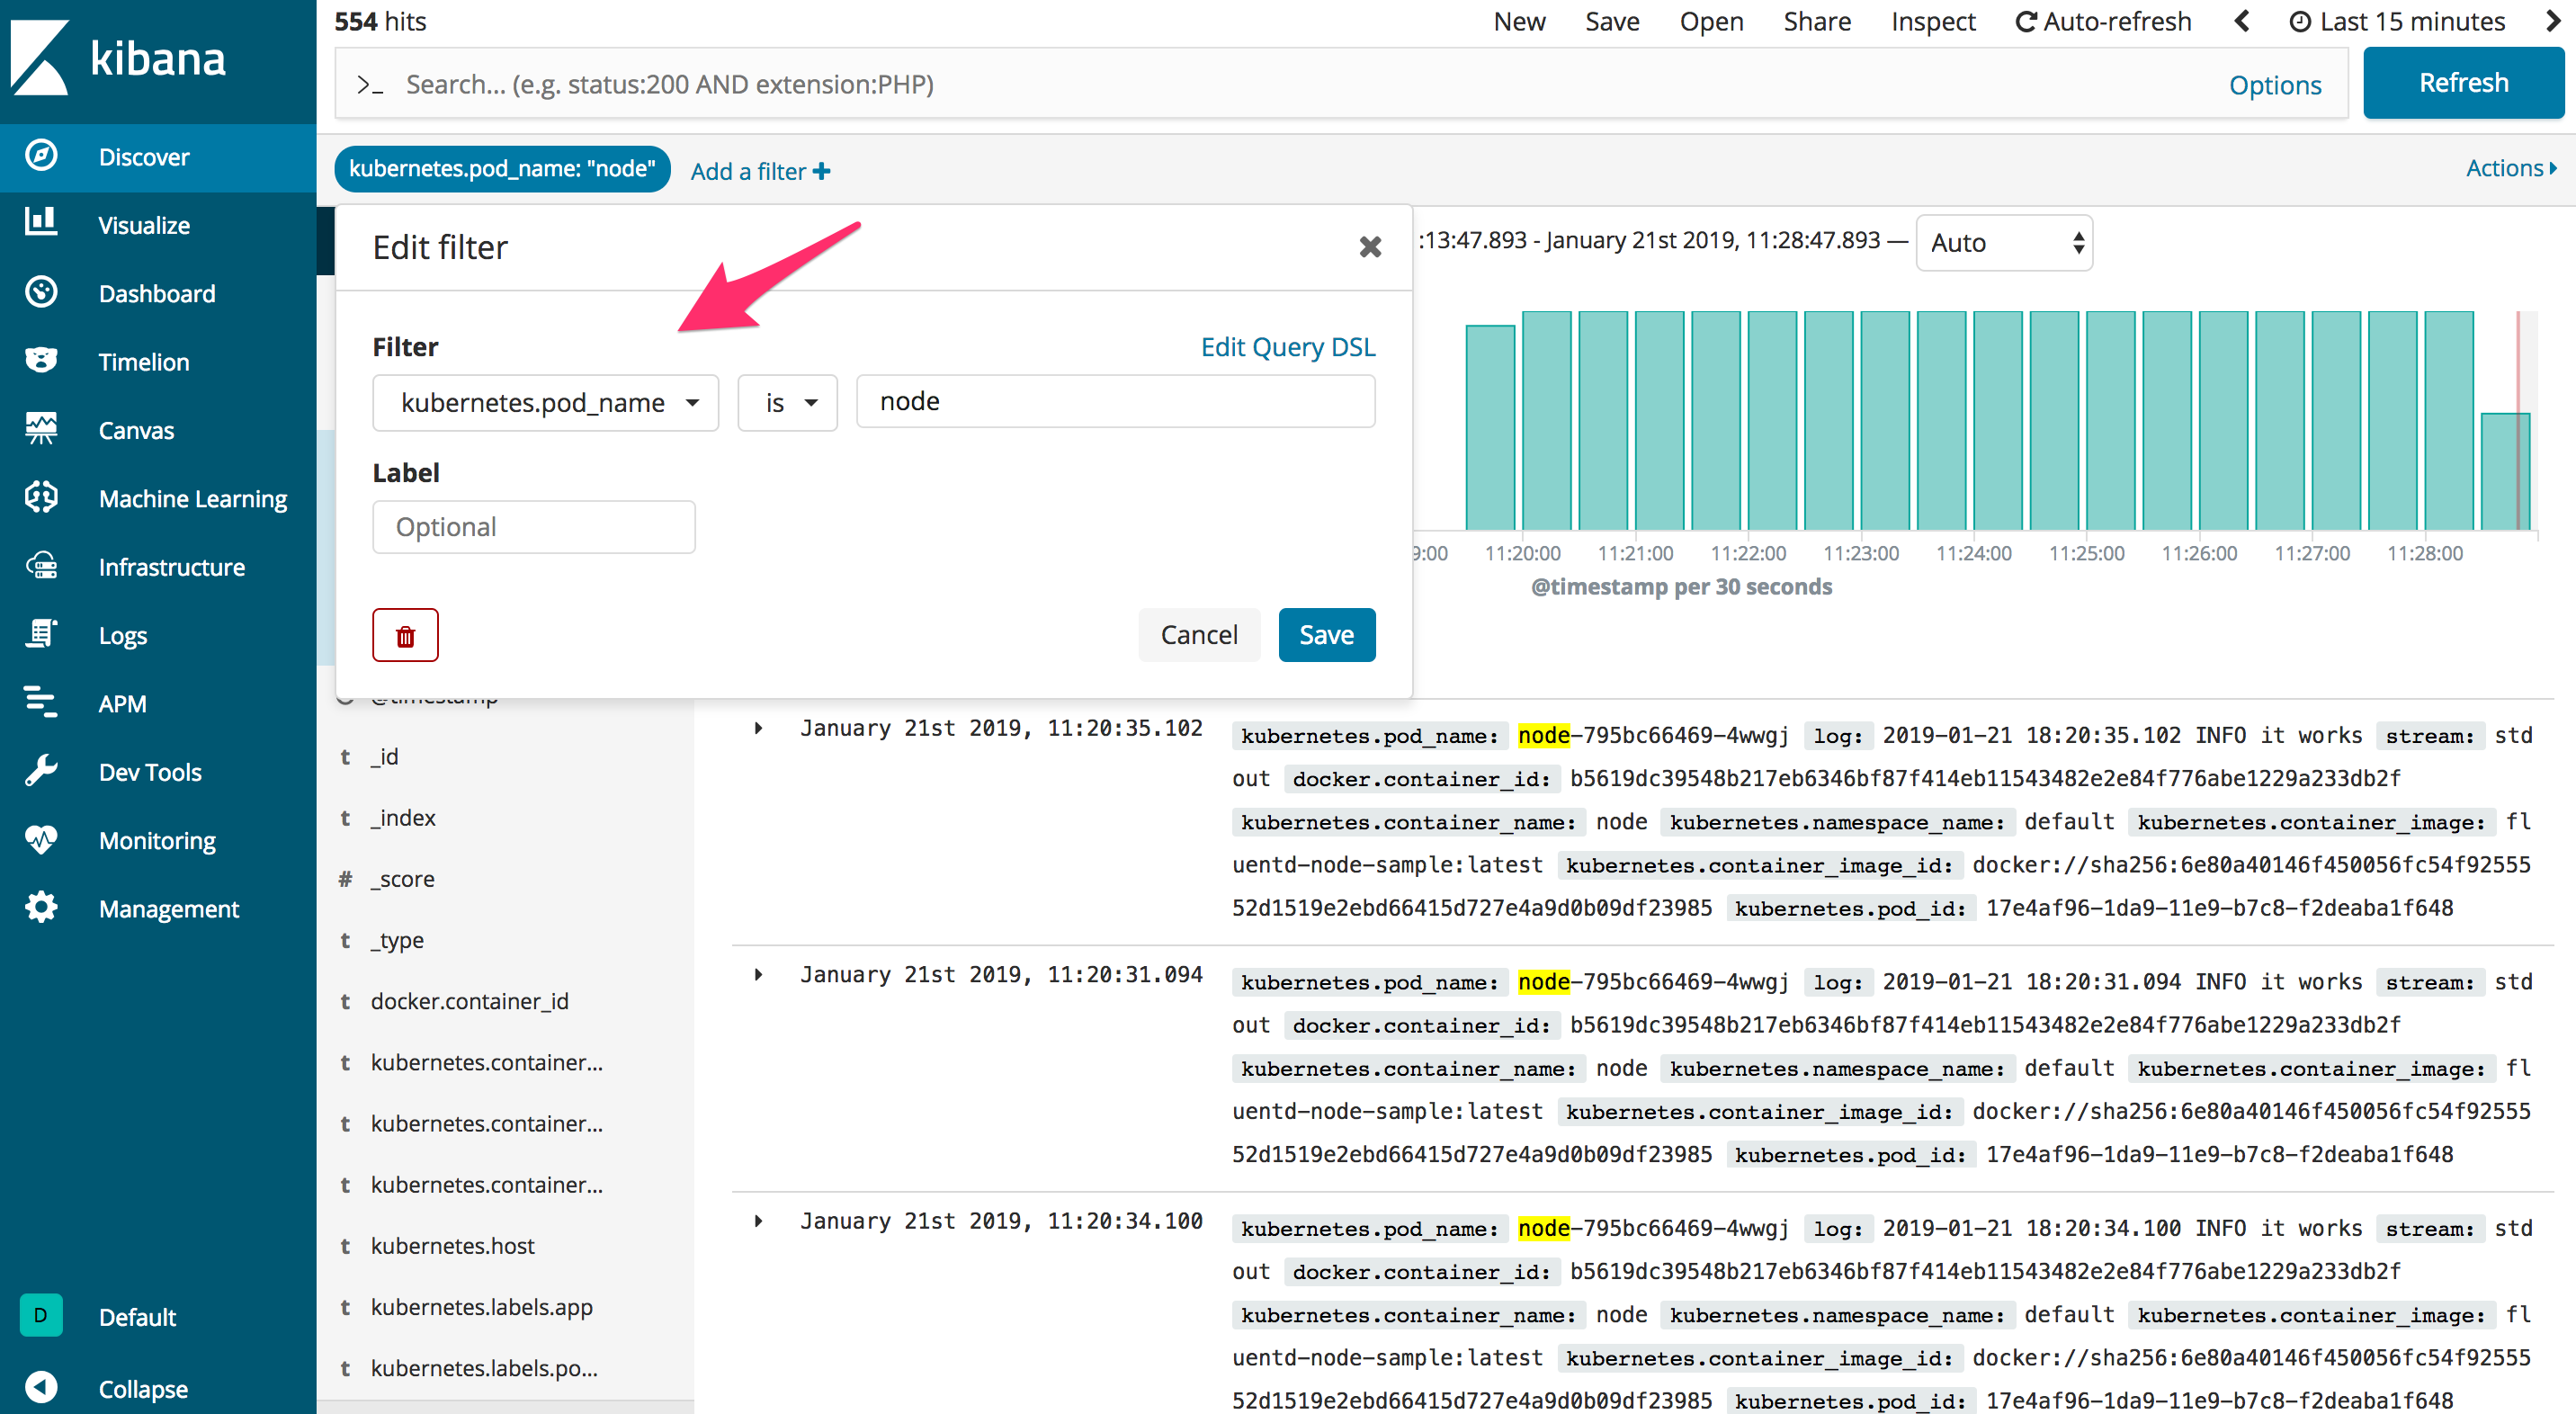
Back in “Discover” on the Kibana dashboard, add the following filter:
- Field:
kubernetes.pod_name - Operator:
is - Value:
node
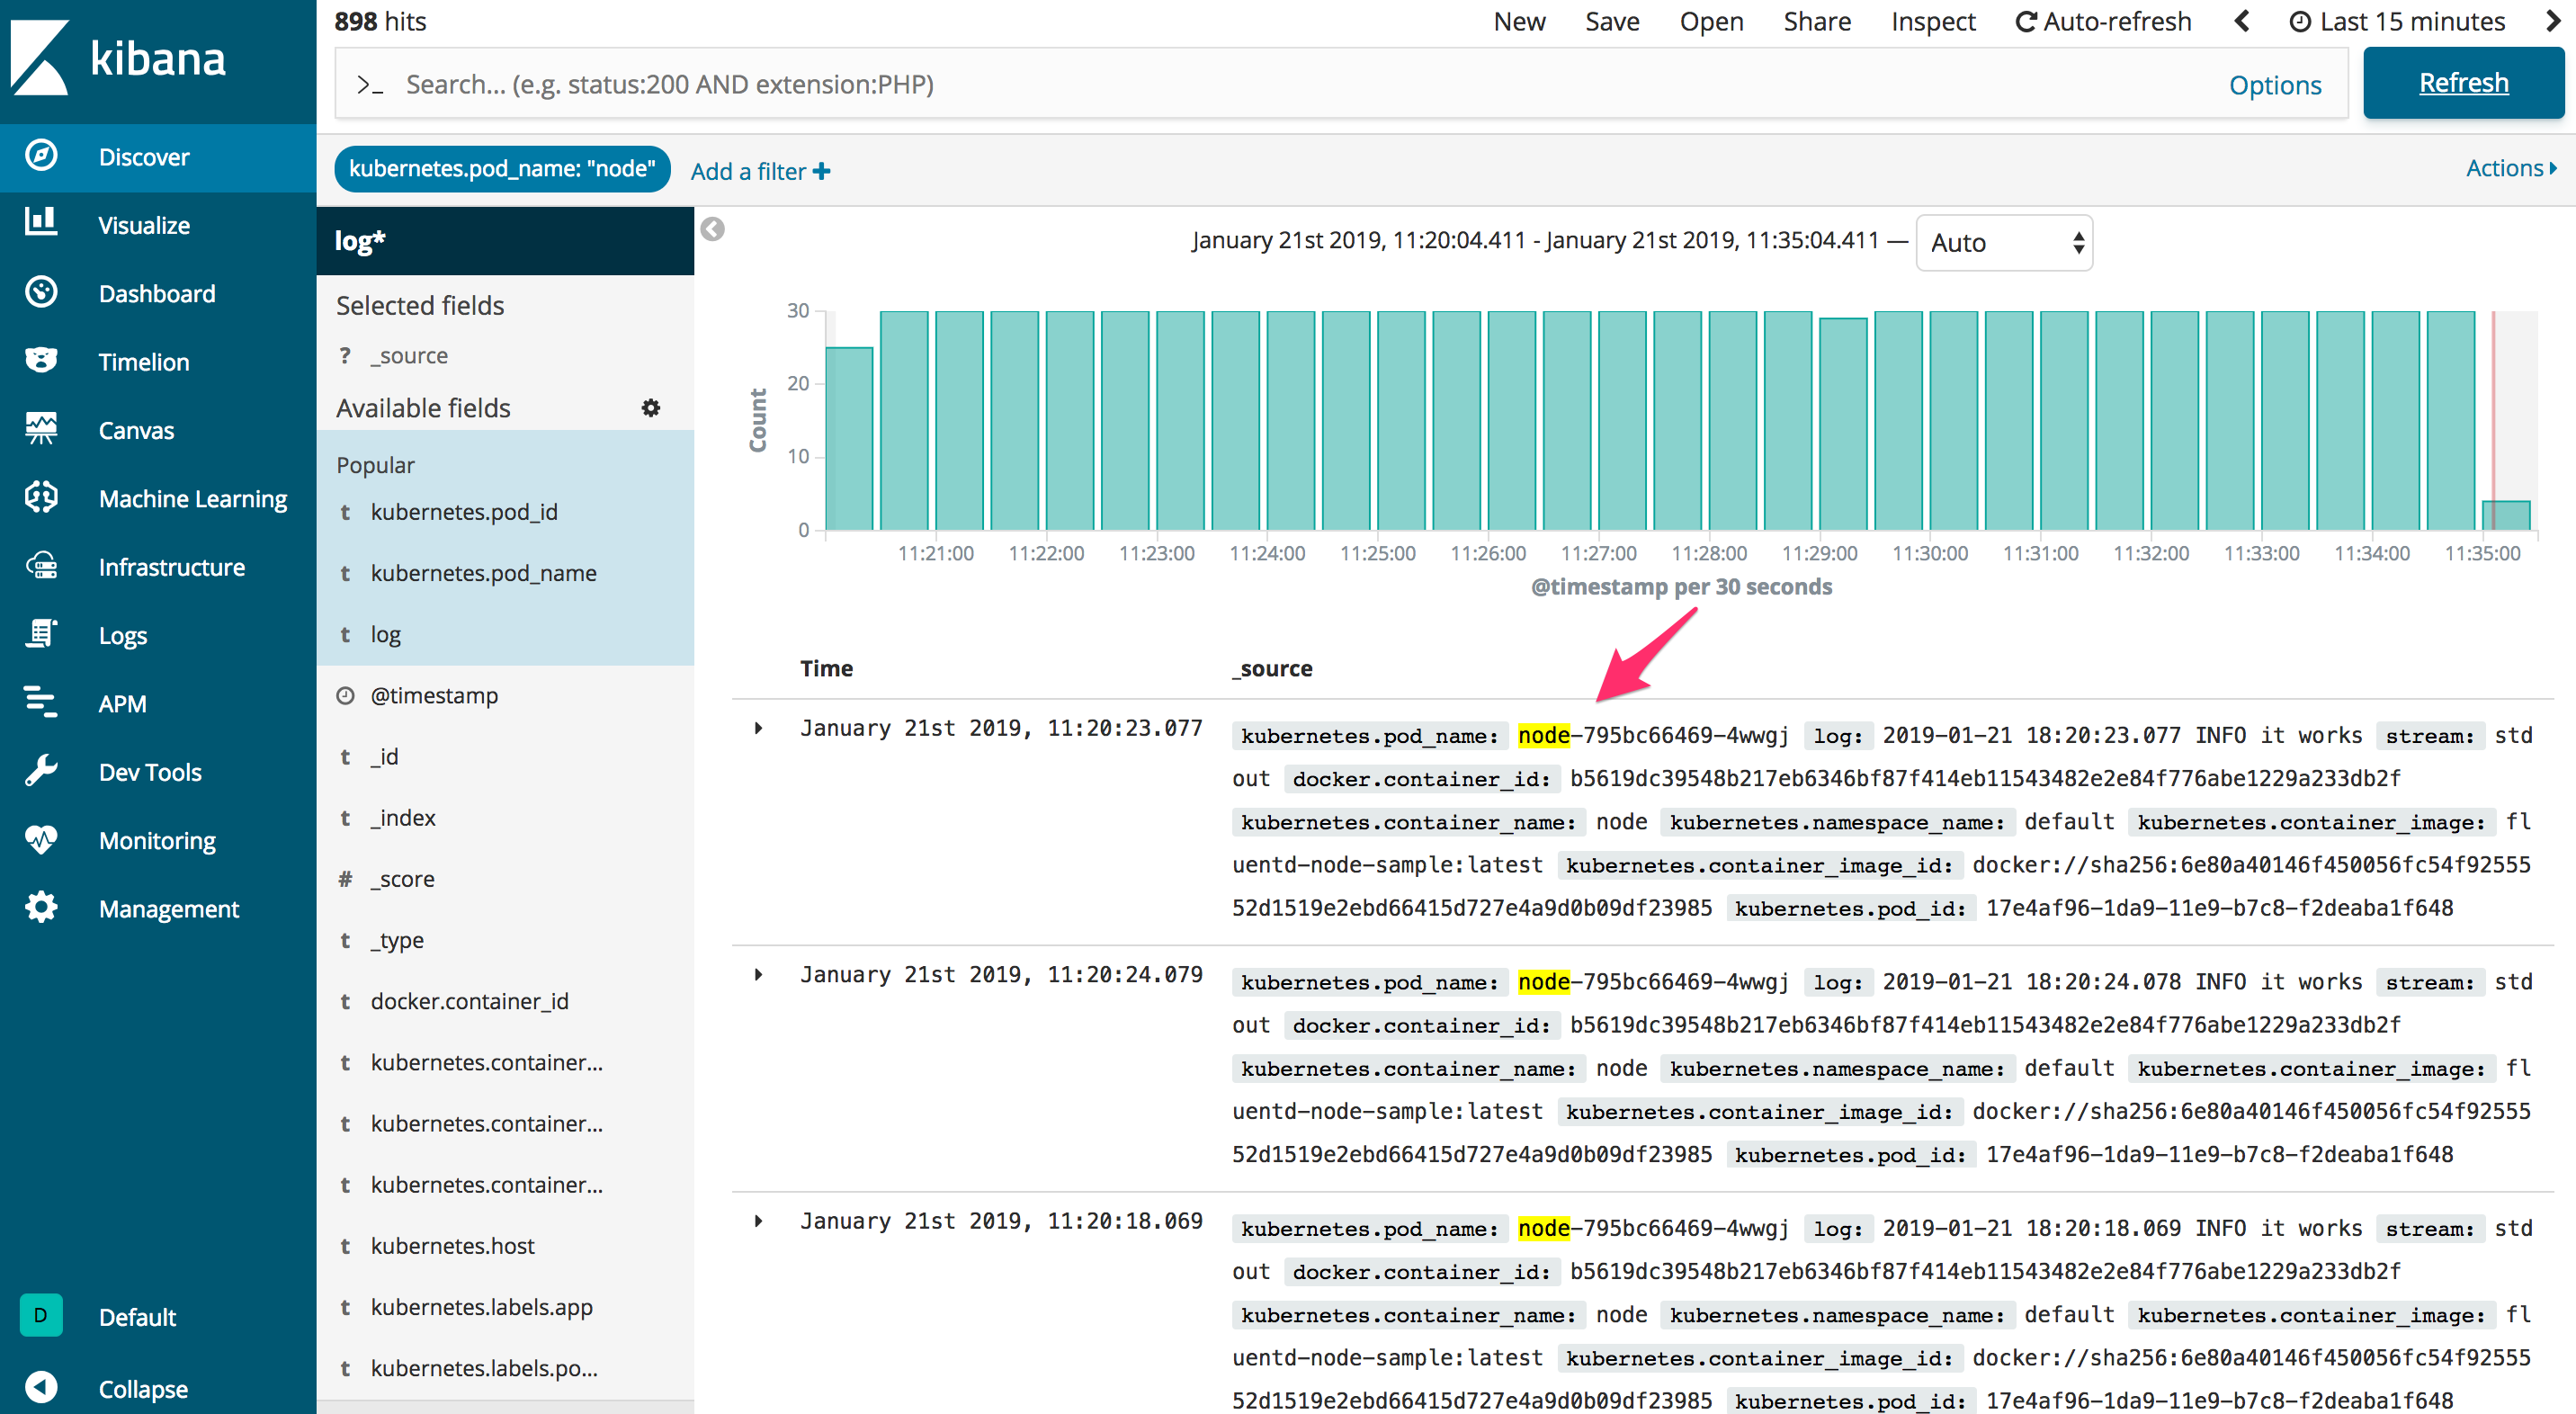
Now, you should be able to see the it works log in the stream.
Again, you can find the code in the efk-kubernetes repo on GitHub.